
Organic Hogwash Case Study
This study is currently ongoing and a collection of the data we acquire while we are implementing our SEO strategies and digital marketing solutions for this local family ran business. We hope this information helps others learn different strategies they can implement for their own businesses and local and organic SEO.
Wix Platform Analytics
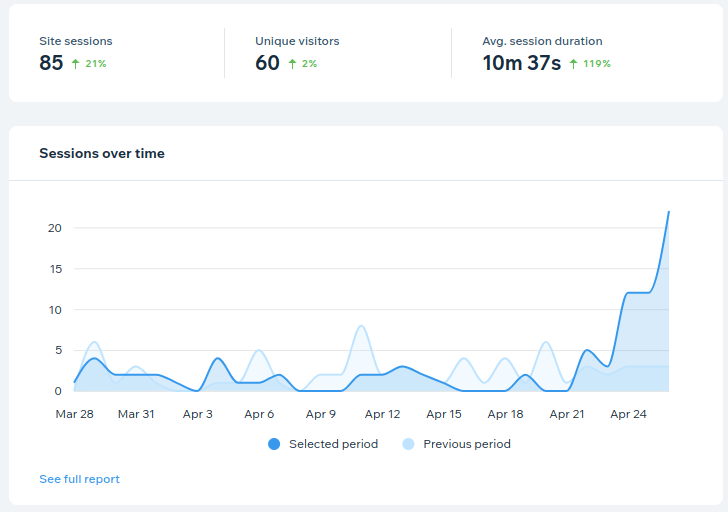
We began our journey with Organic Hogwash on April 23rd 2022. As you can see, their traffic wasn’t doing so great. After having our consultation we found out that 2020 wound up hitting them pretty hard, and now they want to make a comeback. We are glad that the steadfast entrepreneurs over there at the Organic Hogwash headquarters contacted us. With that said, as you can see from the moment we started helping them out, they began picking up some momentum. Thankfully on the digital sea, it’s nothing but open waters and our adventure has just begun.
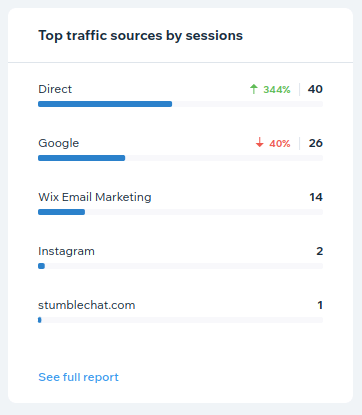
Organic Hogwash Wix Traffic Sources
The moment we joined, we started configuring their Google Business Profile. Adding more information, updating the name, correcting their business category, as well as adding products with links to their product page. Once we completed that step, we moved onto the website redesign. This part of the process took us roughly two days to get it two where we wanted it to be as a starting point.
We then had a meeting with our adventurers to see their thoughts on the progress. They had some different ideas with the font choices which we implemented shortly after the meeting. After making their styling adjustments, we finished the main basic design and began to optimize the mobile pages to make sure they displayed properly. With the final touches on the basic theme of the redesign, we went ahead and sent out an email to all the previous customers of Organic Hogwash. While you can see that helped increase traffic, overall direct traffic to the website has already been on the rise.
Wix Pagespeed Statistics
Unfortunately we did not gather their page speed statistics before the redesign. However, we now have them after the redesign and we will be utilizing this as a starting point.
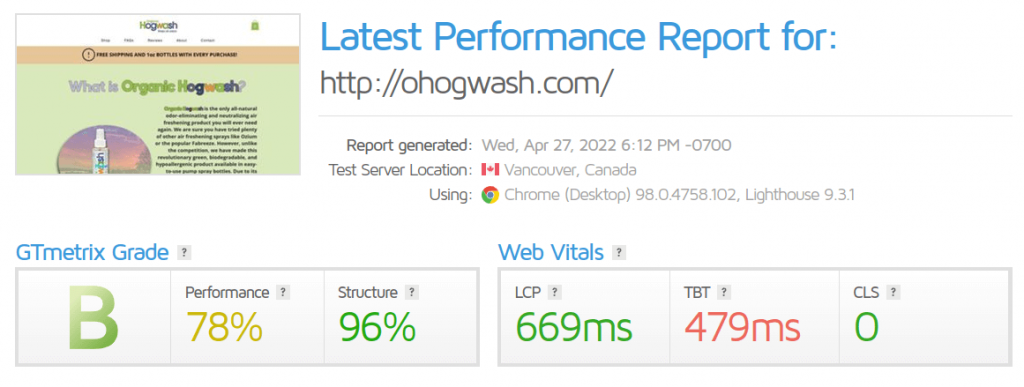
As you can see, with Wix the base GTmetrix report isn’t half bad. First byte response time is around 144ms so that is pretty quick in most standards. The LCP came in at 669ms, which means that’s how long it took the largest content element on the page to load and be visible on the visitors screen. Since this is under 1 second, that is rather good by most standards. Since this product doesn’t have much real competition outside of Fabreeze of Ozium, we think this will help give us an advantage in the future.
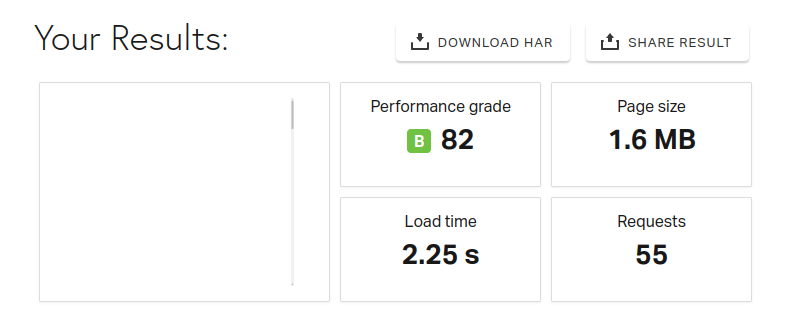
Checking the Pingdom pagespeed report, we can see that we are getting a similar grade as GTmetrix, which is a B. So that is rather good, and without utilizing tools that WordPress has. Tools such as WP Rocket, Lightspeed Cache, W3 Cache, or other page speed enhancing plugins. The load time is clocking in at 2.25s and our page size is under 3 megabytes. All in all, these are pretty solid metrics for the website. Over time we will keep an eye on what these tools are reporting. If there are massive changes we will update this page with them.
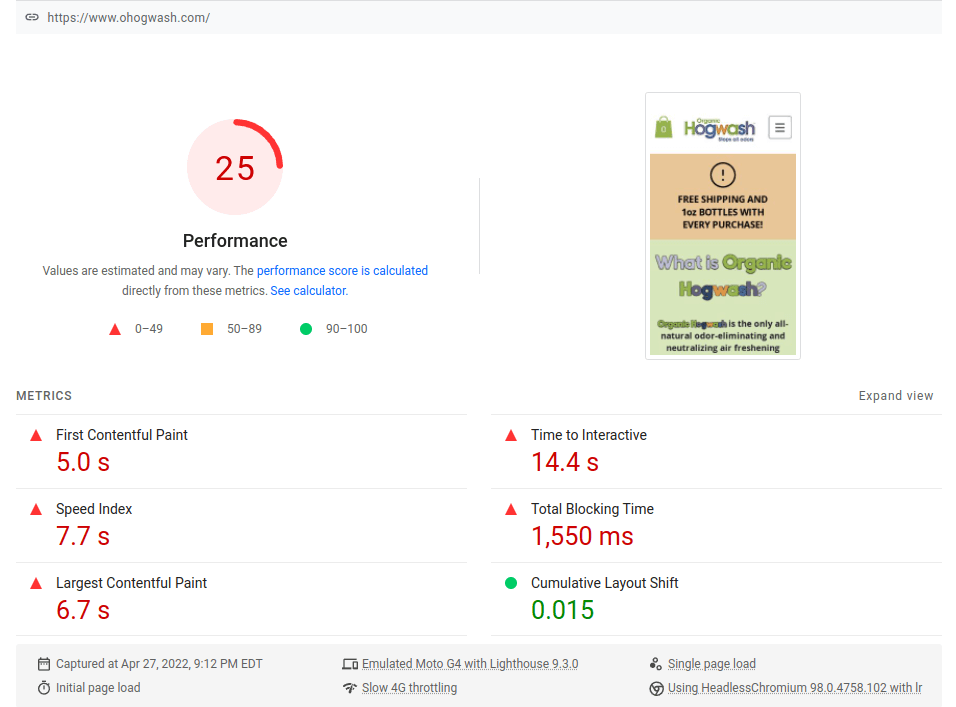
Now we start seeing more of the ugly side of our page speed metrics. The mobile report from Google’s Page Speed Insights doesn’t look too great. However with that said, this will only become a major playing factor if our competitors are beating these stats. If at some point during our case study we find a true competitor to Organic Hogwash, we will see if their stats are any better. If so, that is when we need to start looking into proper solutions, such as possibly moving them from Wix to a better platform such as WordPress.
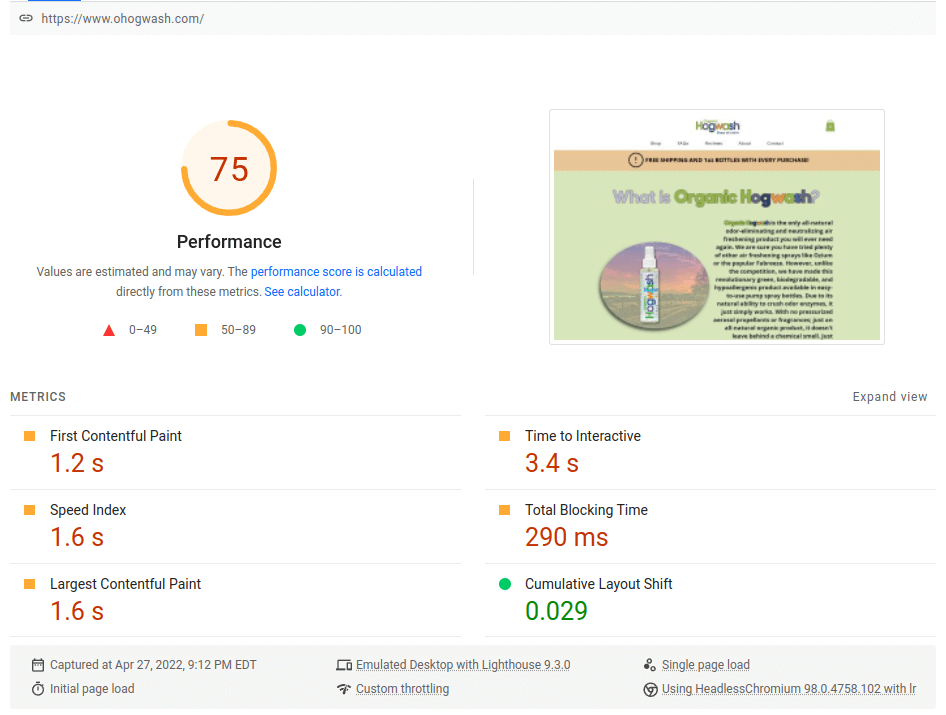
Compared to the mobile statistics, the desktop version doesn’t look half bad. This could be due to a variety of things. One of them being how we have yet to fully look into the way Wix does their caching. If mobile caching isn’t utilized, that could be why the mobile report came back worse than the desktop version. With all of this said, this is just the beginning of this case study. We are excited to see where our adventure with Organic Hogwash takes us, but we hope you enjoy our journey together.
Business Profile Manager
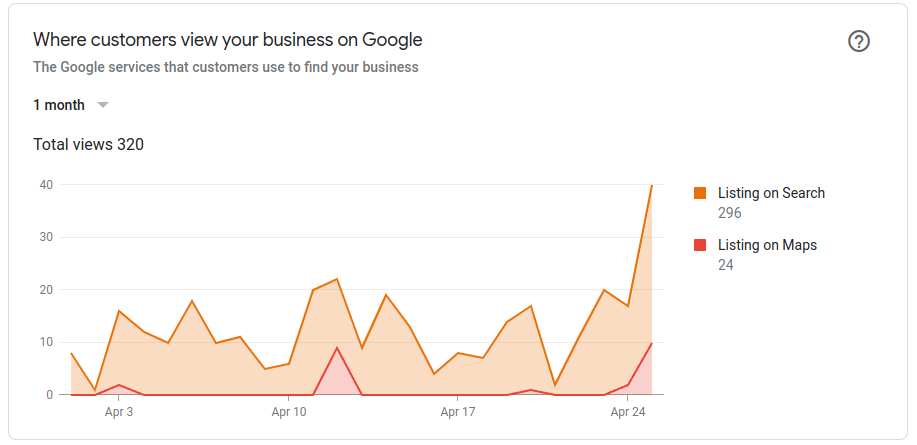
As you can see, shortly after implementing our SEO strategies on the Business Profile Manager, we are already seeing a quick increase in views on their listing on searching Google.
Google Search Console
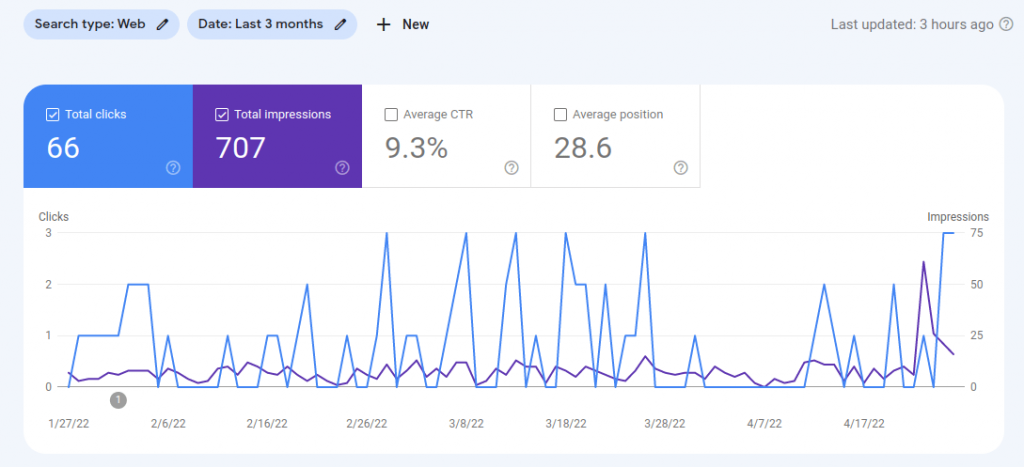
As you can see with the 3 month out chart, our trends look fairly normal. We cannot speak too much in regards to this data, since this is now our control point. We will be basing all future growth from this point forward.
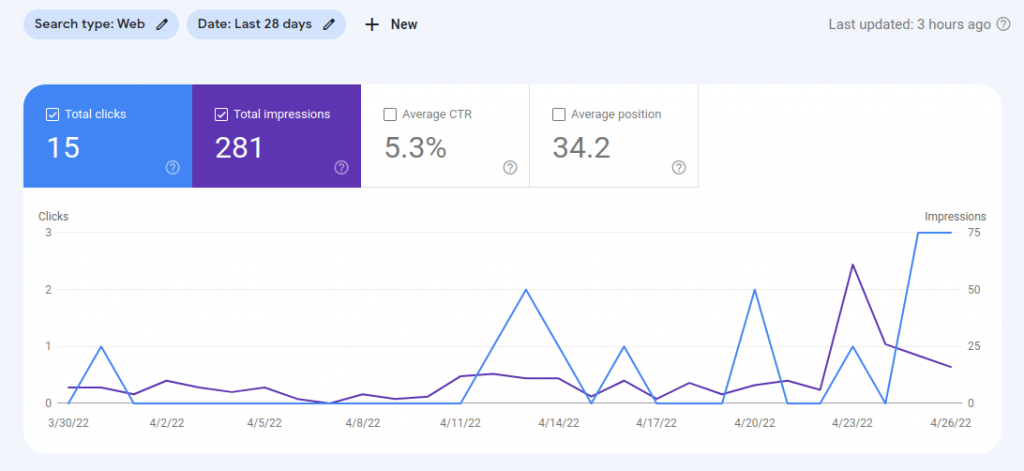
Looking at the 28 day chart, we can see that their statistics still aren’t half bad. Solid click through rate, and okay positioning. It’s a bit of a drop from the 3 month chart, but nothing major.
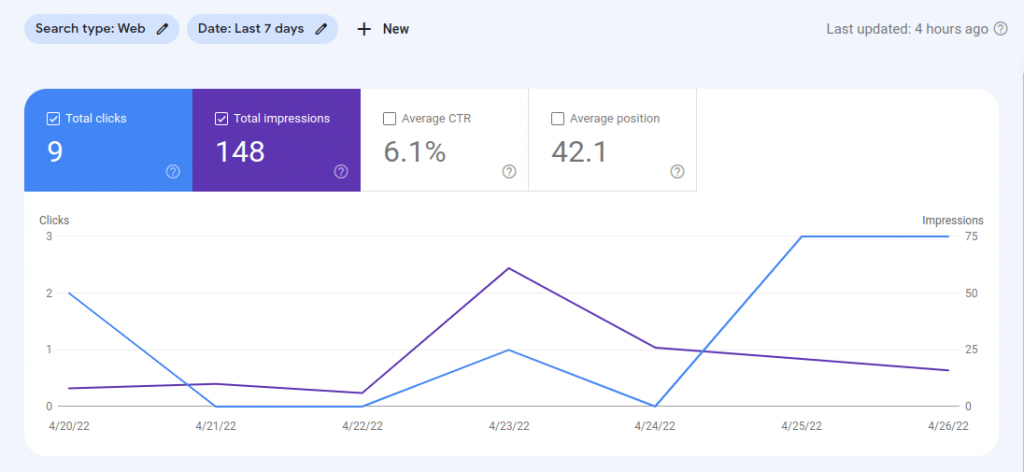
Coming in at 7 days, we can see that the positioning is dropping a bit more, but the click through rate is still staying at a rather solid point. Still room for improvement, but then again this was just the start of our adventure. The sky is the limit from here!
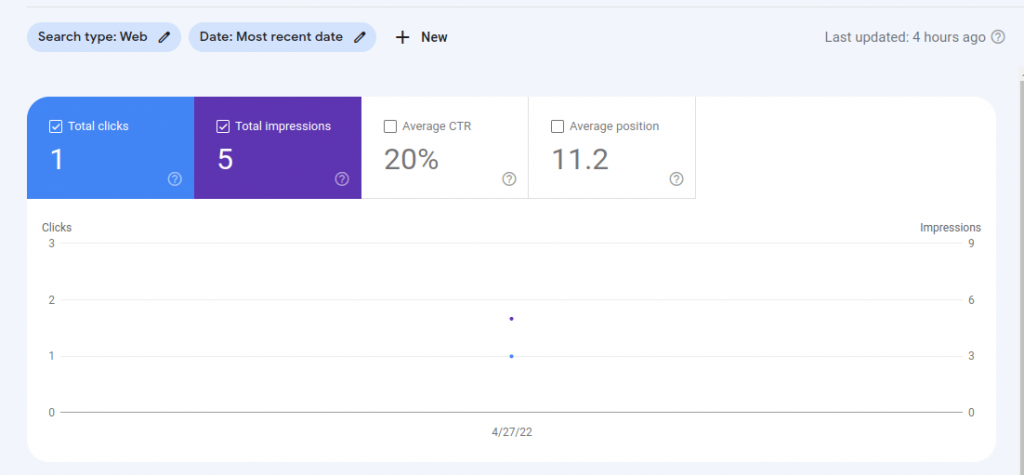
Looking at the most recent date (April 27th 2022) we can see that the stats look much better in terms of click through rate and average position. However the total impressions is still rather low, but it’s still something to start with. Now that the site has been redesigned, we will start implementing even more of our organic SEO strategies to help boost their sales as well as conversions. At this point we just are just weighing our anchor. Let’s get ready to set sail on this Organic Hogwash adventure!